June sale - up to 30% off training courses – use code: JUN26USA
23 April 2024
How to measure and report project performance
When striving to deliver projects quickly and effectively, one thing that can get overlooked is project performance reporting. When everything is moving fast in a project, taking time to step back and...
When striving to deliver projects quickly and effectively, one thing that can get overlooked is project performance reporting. When everything is moving fast in a project, taking time to step back and analyse the performance or pausing to reflect can feel less important than taking action.
However, whether you're steering a small team through a modest initiative or guiding a large organisation through a complex project, making time to monitor and evaluate project performance is vital to ensure you meet objectives and identify any risks or challenges that may arise.
What are the different types of project performance reports?
Reporting provides key snapshots into a project, ensuring the team and relevant stakeholders have the information they need to make decisions, evidence the benefits, and continue to steer the project in the right direction.
Some of the key performance reports you may want to consider using include:
Status reports
Status reports are regular updates on the progress of the project. They typically include information on completed tasks, upcoming tasks, current issues, and any changes in schedule or budget. Status reports are essential for keeping stakeholders informed about where the project stands and what is happening on a regular basis.
How to measure: Track task completion rates, milestone achievements, and the status of project deliverables
Progress reports
Progress reports offer a more detailed look at the project's advancement towards its goals. These reports compare the planned progress (per the project plan) against the actual progress. They may include detailed analyses of tasks completed, the quality of work, and any deviations from the plan.
How to measure: Use project management software to track task progress against the project timeline. Measure the percentage of work completed and compare it with the project schedule to identify any delays or advancements.
Milestone reports
Milestone reports focus on significant points within the project timeline, assessing whether these milestones have been achieved and analysing their impact on the overall project. These reports are handy for tracking the project's critical phases and making decisions regarding subsequent phases.
How to measure: Define clear criteria for what constitutes the achievement of a milestone. Measure this by checking off these criteria as they are completed. The timing of milestone completion compared to the project schedule is also a key metric.
Variance reports
Variance reports analyse the differences between planned and actual performance, including budget, schedule, and scope variance. These reports are crucial for understanding why variances occurred and taking corrective actions to bring the project back on track.
How to measure: Measure cost variance by subtracting the budgeted cost of work performed (BCWP) from the actual cost of work performed (ACWP). A positive number indicates under budget, while a negative number indicates over budget.
Earned value reports
Earned value management (EVM) reports provide a comprehensive overview of project performance and forecast future project performance based on current trends. They combine schedule performance, cost performance, and scope to provide an integrated view of project health. Key metrics include Cost Performance Index (CPI) and Schedule Performance Index (SPI).
How to measure:
- Earned Value (EV): The budgeted amount for the work completed up to the reporting date
- Cost Performance Index (CPI): Measure by dividing EV by the actual cost of work performed (ACWP). A CPI greater than 1 indicates under budget
- Schedule Performance Index (SPI): Calculate by dividing EV by the budgeted cost of work scheduled (BCWS). An SPI greater than 1 indicates being ahead of schedule
Resource utilisation reports
These reports provide insights into how resources are being utilised within the project. They can help identify areas where resources may be over or under-utilised, allowing for better planning and allocation of resources to maximise efficiency.
How to measure: Track the number of hours each resource is scheduled to work versus the actual hours worked. The utilisation rate can be calculated as the actual hours worked divided by the available hours, expressed as a percentage.
Risk reports
Risk reports focus on identifying, analysing, and monitoring project risks. They detail current risks, their impact on the project, and the measures taken to mitigate them. Regular risk reporting is essential for proactive project management.
How to measure: Use a risk register to track and update the status of each risk, including its likelihood, impact, and the effectiveness of mitigation strategies. Risks can be quantitatively rated using a scoring system (e.g., 1 to 5) for likelihood and impact.
Lessons learned reports
Lessons learned reports are compiled after a project or at key stages within a project to document what was successful and what could be improved. These insights are invaluable for improving processes and outcomes in future projects.
How to measure: This is mainly qualitative and involves collecting feedback from project team members, stakeholders, and clients. Surveys, interviews, and workshops can be used to gather insights on what worked well and what didn’t. Quantitative data like project timelines, budget variances, and quality metrics can also inform lessons learned.
Top tips for project monitoring and reporting
As shown, there are many different types of reports you can use when monitoring project performance, but how do you get the most value from these reports.
- Establish key performance indicators (KPIs): The first step in any measurement and reporting strategy is to establish clear, measurable objectives. These should align with the organisation's broader goals and be specific, achievable, relevant, and time-bound (SMART). Common KPIs include project completion percentage, budget variance, return on investment (ROI), and stakeholder satisfaction levels
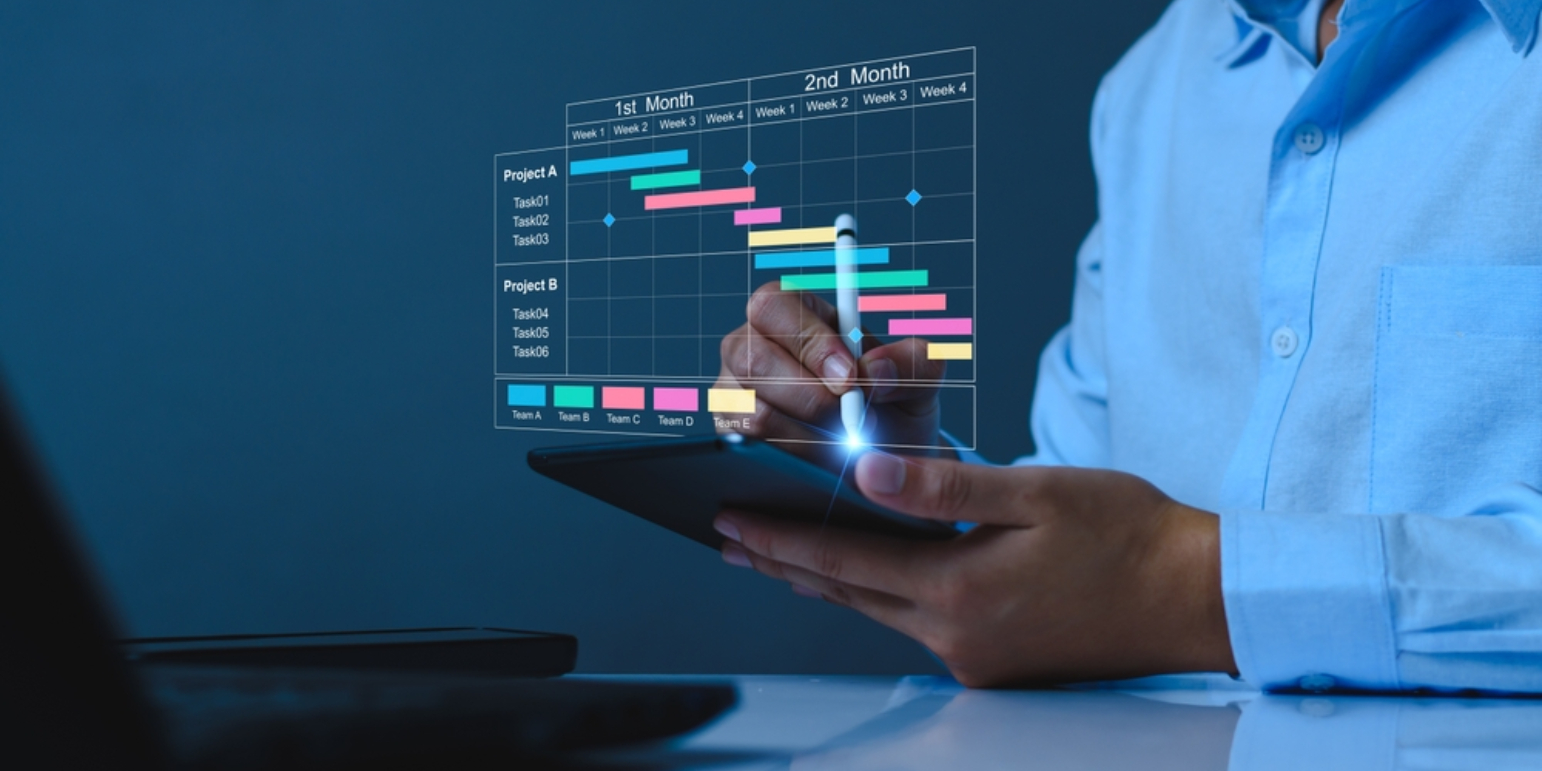
- Implementing effective tools and techniques: Various software and methodologies are available, ranging from traditional Gantt charts and Earned Value Management (EVM) systems to modern project management software like Asana, Trello, and Microsoft Project. These tools not only facilitate real-time tracking of KPIs but also enable the aggregation of data for trend analysis and future forecasting
- Tailoring to your audience: Reporting is not merely about presenting data; it's about telling the story of your project in a way that resonates with your audience. Understand what information your stakeholders need — be they team members, executives, or clients — and tailor your reports accordingly. Visual charts, graphs, and dashboards can convey complex information simply and compellingly. Remember, the goal of reporting is not just to inform but to engage and persuade
- Regular reviews: Effective measurement and reporting are not set-and-forget tasks; they require regular review and adaptation. Schedule periodic review meetings with key stakeholders to discuss the project's progress, challenges, and opportunities
- Leveraging technology: Project management software can automate data collection and analysis, providing real-time insights into project performance. Advanced analytics and AI can identify patterns and predict potential issues before they arise, allowing for proactive project management
Making project performance monitoring a priority
Measuring and reporting on performance plays a pivotal role in the success of any project. Remember, the ultimate aim is not just to complete projects but to complete them in a way that adds value to your organisation and its stakeholders, and effective reporting is integral to this.
Learn best practice for reporting on project performance with a PRINCE2® certification. View our selection of training courses.